

Running a small business is tough. You pay for ads. You show up on social media. You might also pay for blog content. But do you know what is working and what is not?
That is where marketing KPIs come in. KPI stands for “key performance indicator.” You can treat it like a report card for your marketing. It shows what is going right. It shows what needs to change. And the best part is this. You do not need to be a numbers person to use them.
Why You Need to Track KPIs
Most small business owners rely on guesses. You run an ad. You hope it works. You wait for the phone to ring. That is not a strategy. It is a coin flip.
KPIs remove the guesswork. They give you clear data. Did your ad bring new visitors to your site? Did those visitors buy? What did each new customer cost you? Once you have those answers, you can stop paying for what doesn’t work and spend more on what does.
KPIs also keep your team on track. Share clear numbers on how many customers a campaign brought in. That lands harder than any pep talk.
Three Buckets to Watch
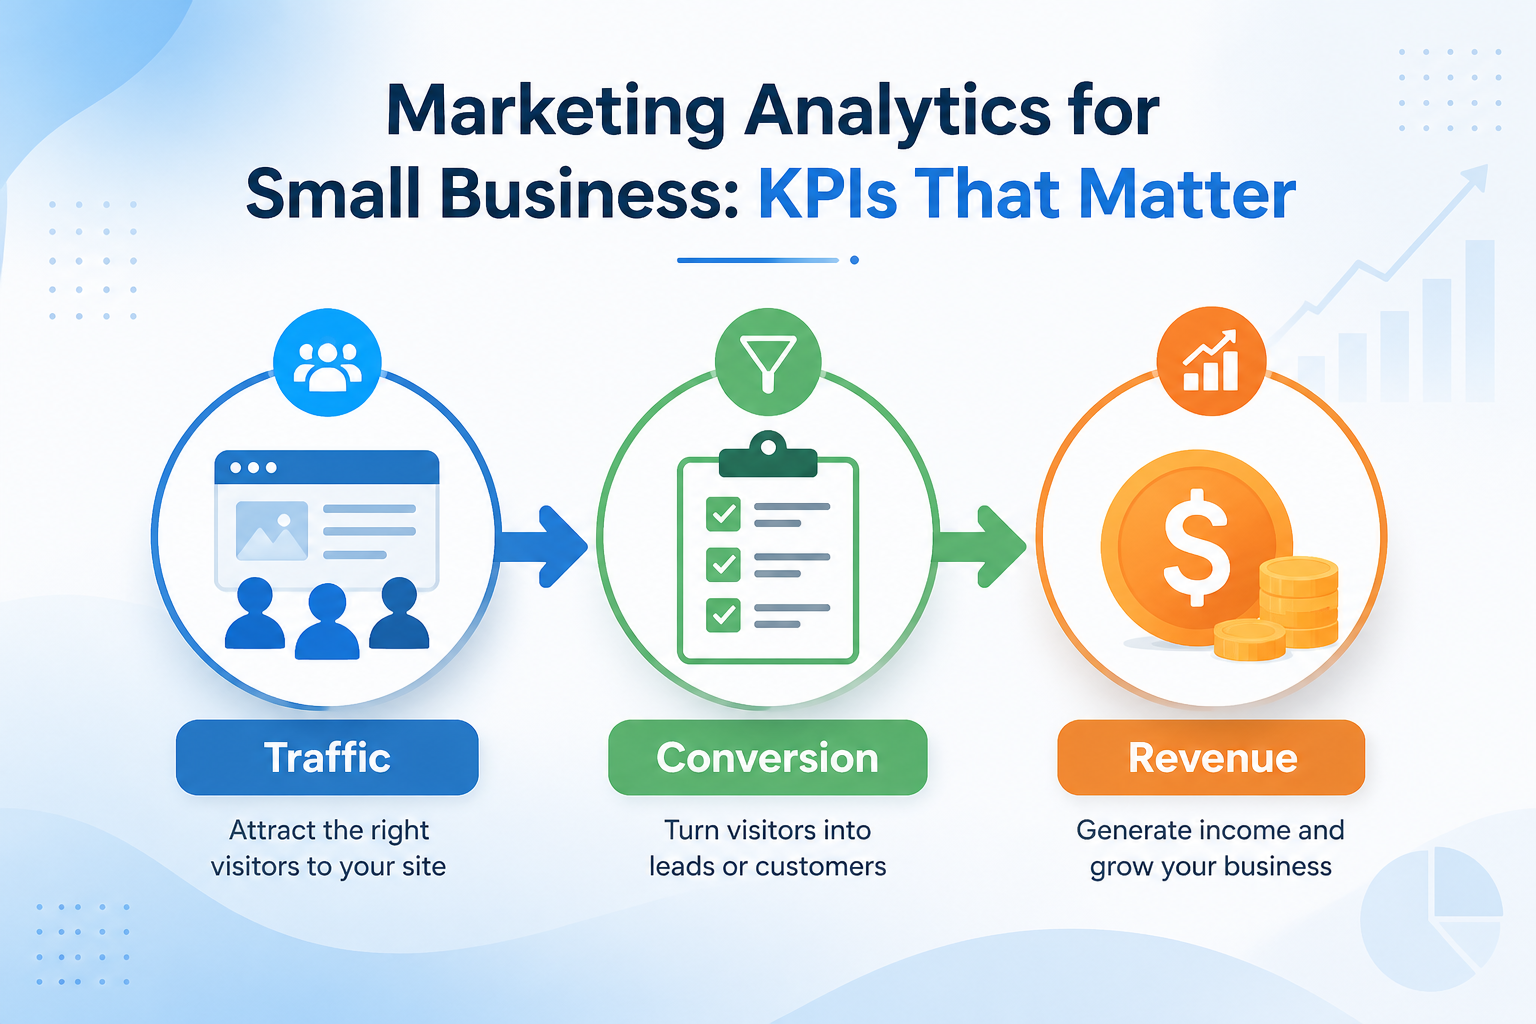
All your marketing KPIs fall into three groups:
- Traffic: Are people finding your site?
- Conversion: Are visitors doing what you want them to do?
- Revenue: Is your marketing bringing in real money?
You need to look at all three. Skip one, and you’ll get a false picture. A spike in traffic looks great until you check conversions and see nobody bought a thing.
Traffic KPIs: Who’s Showing Up?
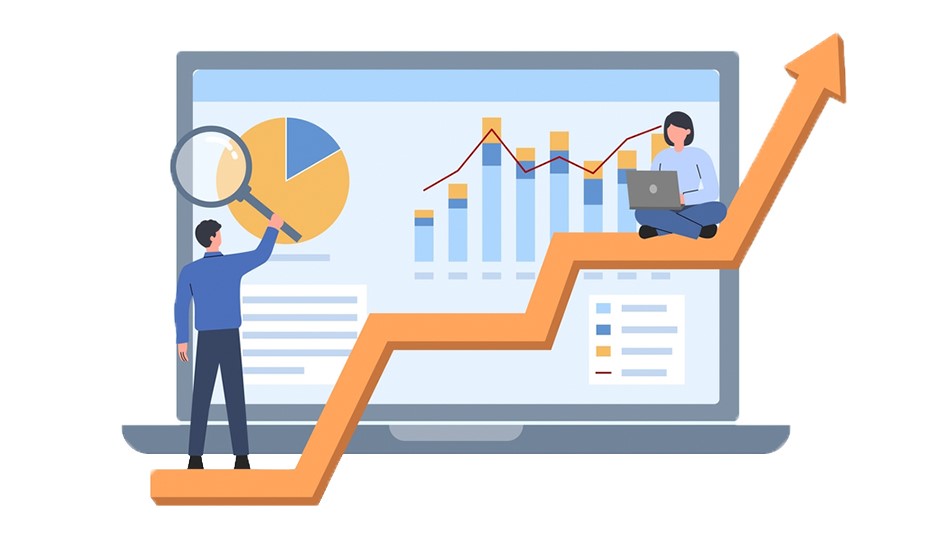
Traffic KPIs tell you how many people visit your site and where they come from. Google Analytics handles most of this for free. Here are the big ones to watch:
Total site traffic. Count how many people visited your site each week or month. Watch for big drops or big spikes. Both are clues worth chasing down.
Traffic sources. Not all visitors arrive the same way. Some find you on Google. Others click on a social media post. Some just type your name straight into the browser. Knowing which channel sends the most people helps you put money in the right place.
- Organic: Found you through a Google search
- Direct: Type your site address in
- Social: Came from a social post or ad
- Paid: Clicked on one of your ads
Mobile vs desktop. Most people browse on their phones now. If your site looks bad on mobile, you’ll lose them fast. Check the split and fix any issues.
Click-through rate. This is the share of people who saw your ad and clicked it. A low rate means people skip right past your ad. Try a new headline or a different image.
Cost per click. This is what you pay each time someone clicks your ad. A strong ad usually brings this number down over time.
Conversion KPIs: Are Visitors Taking Action?
It’s great to have lots of traffic to your site. If people come to your site and take no action, then that traffic is not valuable. Conversion KPIs show you what happens after visitors arrive.
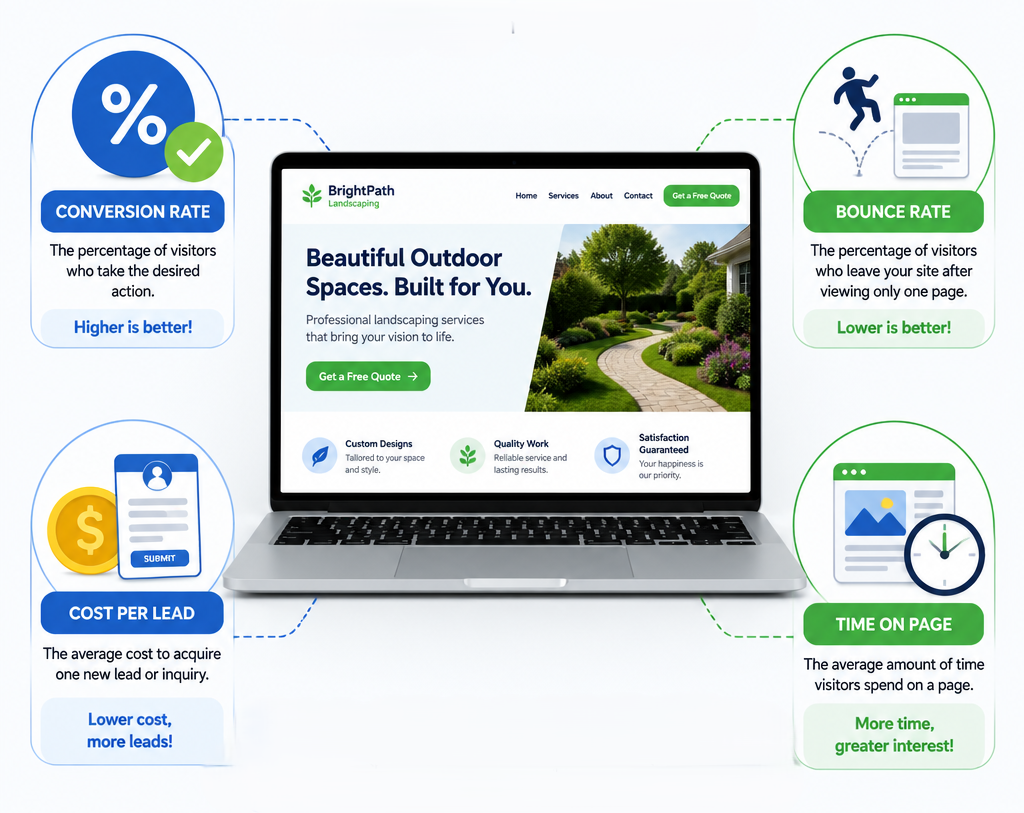
Conversion rate. How many visitors completed your goal? How many bought something? Filled out a contact form? Signed up for a newsletter? If your conversion rate is low, you need to optimize your page seriously.
Bounce rate. A high bounce rate means people are leaving your page quickly. This is usually due to an ad/page mismatch or very slow load times.
Cost per lead. Real leads are potential customers. To find this metric, divide your total ad spend by the number of real leads. If this number is high, you need to optimize your campaign.
Time on page. This is all about visitor engagement. Do visitors spend a lot of time or a short time on your page? Spending a lot of time usually means they have found what they were looking for.
Revenue KPIs: Did the Money Come In?
This is the part that matters most. All the traffic and all the conversions don’t count if no real money comes in.
Return on investment. Take the revenue your campaign brought in. Subtract your total campaign cost. Divide that by what you spent. A positive result means you made money. A negative result means the campaign cost more than it earned.
Customer acquisition cost. Add up all your marketing costs. Divide by the number of new paying customers you got. This shows the real cost of each new customer. Keep it as low as you can.
Don’t Just Watch One Number
Many small business owners make this mistake. They see traffic go up and celebrate. But nobody bought anything.
Or they see a campaign bring in just a handful of leads and call it a failure. But those few leads turn into the biggest sales of the month.
That’s why you track all three groups together. Traffic, conversion, and revenue. Together, they tell the real story.
Start Simple. Stay Consistent.
You don’t need fancy tools. Google Analytics covers most of this for free. Your ad platforms show click and cost data right in the dashboard.
Start with three to five KPIs. Check them every week. Over time, patterns show up, and you’ll start to see what’s working. Then you can make better calls about where your money goes.
Stop guessing. Let the numbers lead the way.